
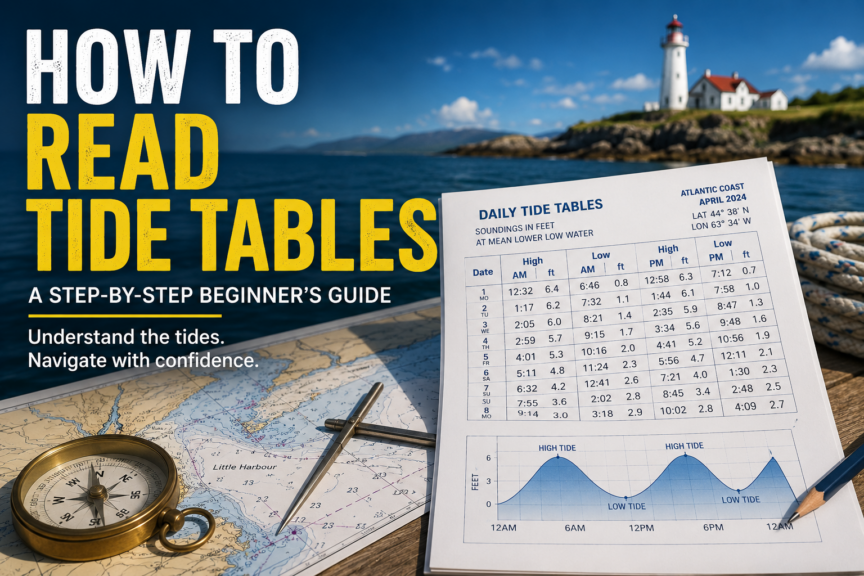
Tides are one of those parts of sailing that can seem complicated until someone explains what the numbers actually mean.
Open a tide table for the first time and you may see a collection of times and heights that look more like a schedule than useful sailing information.
But those few numbers can answer some very important questions.
Will there be enough water to leave the harbour?
Will that shallow passage be deep enough when you arrive?
Is the water rising or falling?
How much deeper will your anchorage become overnight?
And if you have to cross a shallow area on the way home, when will you have enough water to do it safely?
Learning how to read tide tables turns those numbers into useful information.
The good news is that you don’t need to become an expert in tidal astronomy to use them.
For beginner sailors, the important skill is understanding what a tide table tells you, how that information relates to your nautical chart, and how to use the two together when making practical decisions on the water.
By the end of this guide, you should be able to read a basic tide table, identify high and low water, determine whether the tide is rising or falling, estimate the height of tide between high and low water, calculate approximate water depth, and use tide information when planning a simple coastal sail.
Beginner Tip: Don’t try to memorize tide tables. Learn how to interpret them. The numbers change every day, but the method for reading them stays largely the same.
About this Guide
Written by Kelly Hiebert, a recreational sailor since 2002 and a middle-school teacher. Kelly created Sailboat Zone to provide beginners with clear, structured sailing education.
Last reviewed: September 2026
Jurisdiction: This guide explains general principles for reading tide predictions and estimating water depth, using Canadian Hydrographic Service information as its primary reference. Tide patterns, datums, time references, units and prediction formats vary by location. Always use current official predictions for the correct station and date, and confirm that chart and tide datums are compatible before combining their values.
Primary sources:
- Canadian Hydrographic Service — Tides, Currents and Water Levels
- Canadian Hydrographic Service — Canadian Tide and Current Tables
- Canadian Hydrographic Service — Canadian Chart 1: Chart Datum and Depths
Safety note: Tide predictions and calculated water depths are estimates, not guarantees. Confirm the correct station, date, time reference, units and datum; use current official information; and allow a prudent under-keel safety margin. Account for weather, waves, survey uncertainty, the boat’s actual loaded draft and changing conditions, and compare predictions with charts, depth-sounder readings and direct observations.
What Is a Tide Table?
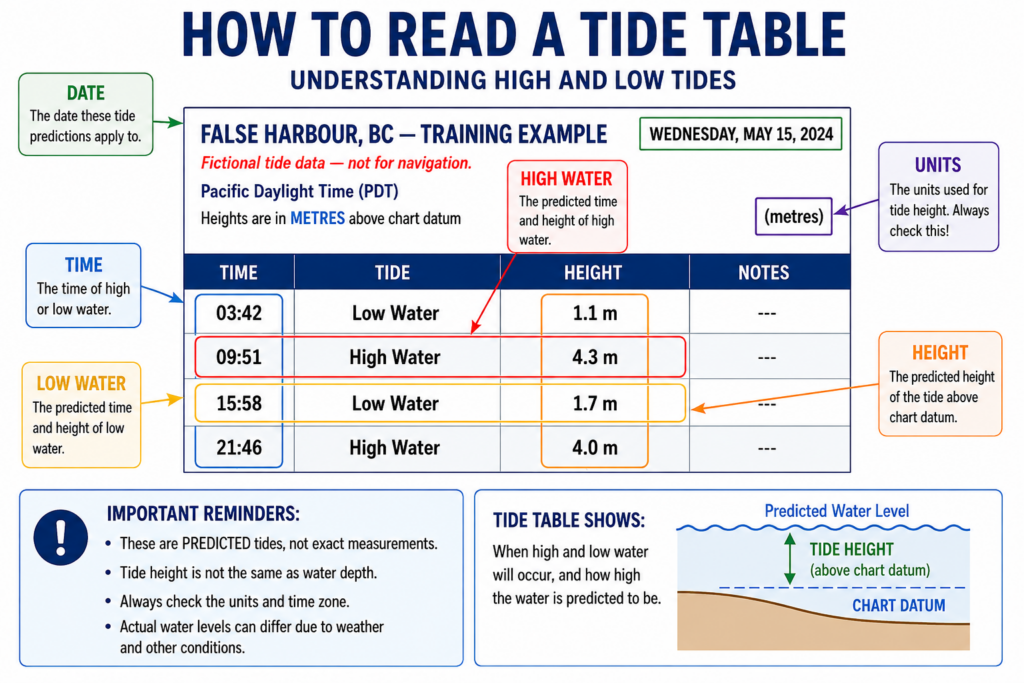
A tide table is a prediction of how the water level is expected to change at a particular location.
At its simplest, a tide table usually gives you two pieces of information:
Time — when high or low water is predicted to occur.
Height — how high the water is predicted to be relative to a specified vertical reference, or datum.
A simplified tide table might look like this:
| Time | Event | Height |
|---|---|---|
| 03:42 | Low Water | 1.1 m |
| 09:51 | High Water | 4.3 m |
| 15:58 | Low Water | 1.7 m |
| 21:46 | High Water | 4.0 m |
From just those four entries, we already know quite a lot.
At 03:42, the water reaches a predicted low of 1.1 meters.
It then rises until 09:51, when it reaches a predicted high of 4.3 meters.
After that, the water falls until 15:58.
Then it rises again toward the next high water at 21:46.
That rise and fall continues day after day.
Real tide tables may be presented differently depending on the country, hydrographic authority, website, app or chartplotter you use, but the basic information remains similar.
Tide Tables Are Predictions
There is one word in the previous explanation that deserves special attention:
Prediction.
A tide table does not guarantee the exact water level you will encounter.
Tidal predictions are calculated from astronomical tidal behavior and observations, but actual water levels can also be affected by atmospheric pressure, wind, storms and other local conditions.
Think of a tide table as an extremely useful planning tool—not a promise about exactly where the water will be.
Understanding the Basic Tide Cycle
Before we start calculating anything, let’s understand what the water is doing.
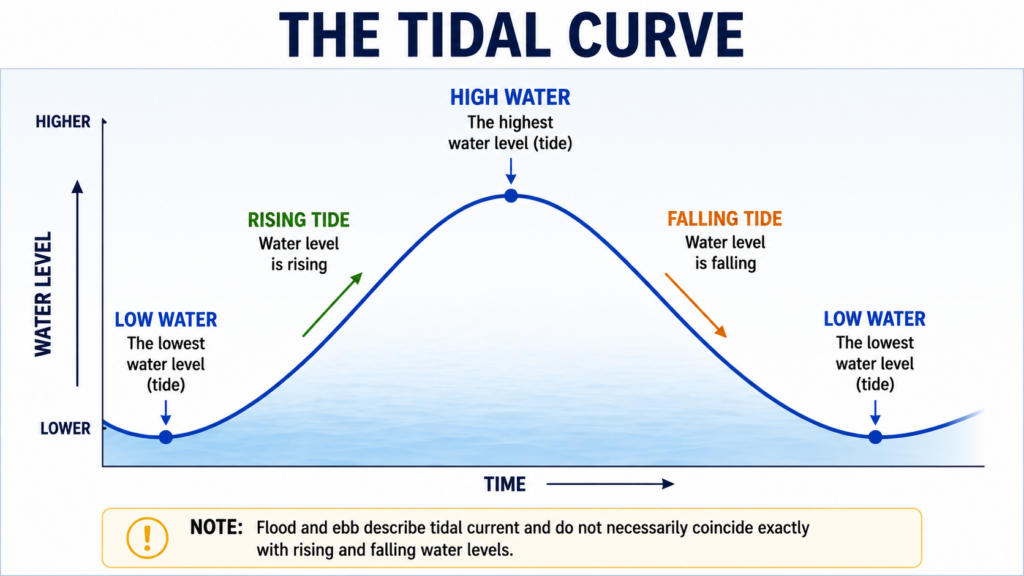
When the water level is increasing, we say the tide is rising.
The period during which the water level rises is commonly associated with the flood tide.
Eventually the water reaches high water.
The water level then begins to fall.
The falling portion of the cycle is commonly associated with the ebb tide.
Eventually the water reaches low water.
Then the cycle begins again.
For a beginner, the most useful first question is often simply:
Is the water rising or falling?
Return to our example:
| Time | Event | Height |
|---|---|---|
| 03:42 | Low | 1.1 m |
| 09:51 | High | 4.3 m |
| 15:58 | Low | 1.7 m |
| 21:46 | High | 4.0 m |
Suppose it is 07:00.
The previous event was low water at 03:42 and the next event is high water at 09:51.
Therefore, the water is rising.
At 12:00, the previous event was high water at 09:51 and the next event is low water at 15:58.
The water is falling.
You don’t need a formula to determine that. You simply look at where your time falls between the predicted highs and lows.
Not Every Place Has the Same Tidal Pattern
You may have heard that there are approximately two high tides and two low tides every day.
That is common—but it isn’t universal.
Tidal patterns are generally described as:
semifinal Tides
A semidiurnal pattern normally has approximately two high waters and two low waters each tidal day, with the two highs being reasonably similar and the two lows reasonably similar.
Diurnal Tides
A diurnal pattern normally has one high water and one low water during a tidal day.
Mixed Tides
A mixed tidal pattern often has two highs and two lows, but their heights may differ considerably.
Mixed tides are particularly relevant to sailors on the Pacific coast of North America.
This is one reason beginners shouldn’t assume every tide behaves like the smooth, perfectly symmetrical tidal curve often shown in introductory diagrams.
Real tides can be much messier.
How to Read a Tide Table Step by Step
When you open a tide table, resist the temptation to immediately grab the first high and low numbers you see.
There are several things to confirm first.
Step 1: Confirm the Location
Tides vary from place to place.
Two harbors that appear relatively close together may have different times and heights of high and low water.
Always make sure you’re looking at the correct tidal station—or understand how your location relates to the station being used.
Step 2: Confirm the Date
This sounds obvious.
It is also an easy mistake to make.
If you’re planning tomorrow’s sail while looking at today’s predictions, every calculation that follows may be wrong.
Check the date first.
Step 3: Check the Time Zone
Make sure you understand which time standard the table uses.
Depending on the source and settings, predictions may be displayed using local standard time, daylight time, UTC or another specified time reference.
Don’t assume.
Check.
Step 4: Check the Units
Are heights given in:
- meters,
- feet,
- or another unit?
If your nautical chart uses meters but your tide information is displayed in feet, convert the units before combining the numbers.
Step 5: Identify High and Low Water
Find the high and low water events surrounding the time you’re interested in.
Step 6: Determine Whether the Tide Is Rising or Falling
If your time falls between low water and high water, the water level is rising.
If your time falls between high water and low water, the water level is falling.
Step 7: Note the Heights
The height numbers tell you the predicted water level relative to the datum used for those predictions.
And that brings us to one of the most important concepts in this entire article.
Tide Height Is Not Water Depth
Suppose your tide table says:
High Water: 4.3 m
Does that mean the water is 4.3 meters deep?
No.
This is one of the most important distinctions a beginner can learn.
The height of tide and the depth of water are different measurements.
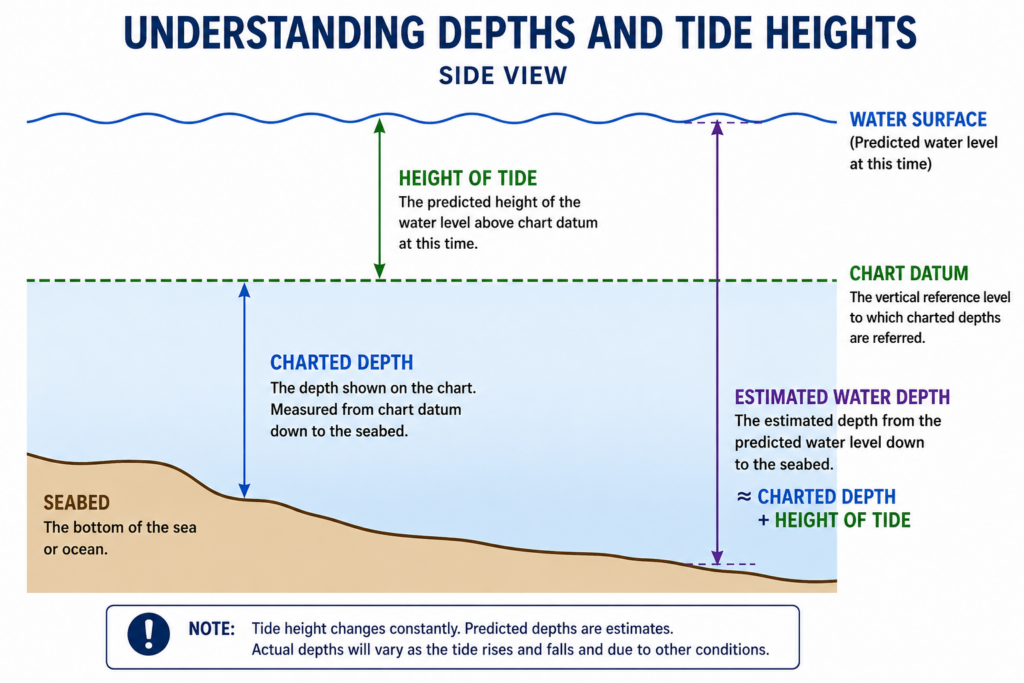
The tide height tells you how high the predicted water level is relative to a defined vertical reference.
The nautical chart tells you the charted depth of the seabed relative to its chart datum.
When the relevant references are compatible, you can combine those pieces of information to estimate how much water should be over the seabed.
Understanding Chart Datum
Imagine an invisible horizontal reference plane running through the water.
Charted depths are referenced to a defined vertical datum.
Tidal heights are also expressed relative to a specified datum.
For practical navigation, you need to make sure you understand the datum used by your chart and tide information before combining the two.
On many nautical charts used for tidal waters, chart datum is selected near a low-water reference so that charted depths provide a useful basis for navigation. The exact datum convention varies by hydrographic authority and region.
That is why you should read the notes and datum information on the actual chart rather than assuming every chart in the world uses exactly the same reference.
If you haven’t already learned how charted depths work, read How to Read a Nautical Chart next. Understanding chart datum is the bridge between chart reading and tide planning.
Calculating Approximate Water Depth
Once you understand the relationship between the chart and the tide prediction, the basic calculation is simple.
Charted Depth + Height of Tide ≈ Estimated Water Depth
Suppose your nautical chart shows a depth of:
2.0 m
At the time you plan to pass over that location, the predicted height of tide is:
3.1 m
Your approximate water depth would be:
2.0 m + 3.1 m = 5.1 m
That is much more useful than simply knowing that the tide is “three meters high.”
You now have an estimate of how much water should actually be available.
However, remember the word approximate.
Predictions, datum relationships, weather, waves, survey uncertainty and other factors mean this shouldn’t be treated as a millimeter-accurate measurement.
From Water Depth to Under-Keel Clearance
Knowing the total water depth still doesn’t tell you whether your sailboat can safely pass.
For that, you also need to know your boat’s draft.
Draft is the vertical distance your boat extends below the waterline.
Suppose our estimated water depth is:
5.1 m
Your sailboat draws:
1.8 m
Your approximate under-keel clearance is:
5.1 − 1.8 = 3.3 m
So the basic relationship is:
Estimated Water Depth − Boat Draft = Approximate Under-Keel Clearance
That calculation is straightforward.
The judgment comes afterward.
A calculated clearance is not a guarantee that you will have exactly that amount of space beneath your keel.
A prudent sailor considers an appropriate safety margin rather than planning to scrape past a hazard simply because the arithmetic says there should be a few centimeters to spare.
A More Realistic Shallow-Water Example
Suppose you’re sailing toward a harbour entrance.
Your sailboat draws:
1.8 m
The shallowest charted depth along your intended route is:
1.2 m
The predicted height of tide when you expect to arrive is:
1.4 m
First calculate estimated water depth:
1.2 + 1.4 = 2.6 m
Then subtract your draft:
2.6 − 1.8 = 0.8 m
Your estimated under-keel clearance is therefore:
0.8 m
Is that safe?
The arithmetic alone cannot answer that question.
You also need to consider sea state, the reliability and age of the charted information, weather effects on water level, your confidence in the predicted arrival time, your boat’s actual loaded draft and an appropriate safety margin.
This is an important change in thinking.
Good navigation isn’t simply about getting the calculation right.
It’s about understanding how much confidence you should place in the answer.
What Happens Between High and Low Tide?
Tide tables commonly make high and low waters easy to identify.
But boats rarely arrive exactly at high or low water.
Suppose:
Low water occurs at 09:00 at 1.0 m.
High water occurs at 15:00 at 4.6 m.
You want to enter a harbour at noon.
What is the height of tide then?
We need to estimate what happens between the listed high and low waters.
The simplest approach would be linear interpolation.
The tidal range is:
4.6 − 1.0 = 3.6 m
Noon is halfway between 09:00 and 15:00.
If the water rose at a perfectly constant rate, half of the 3.6 m range would have occurred:
3.6 ÷ 2 = 1.8 m
Add that to the low-water height:
1.0 + 1.8 = 2.8 m
But there is a problem.
The tide generally does not rise and fall at a constant rate.
So linear interpolation is only a rough approximation.
When accurate official predictions for the desired time are available, use them.
The Rule of Twelfths
Sailors have traditionally used a shortcut called the Rule of Twelfths to estimate how much the tide rises or falls between high and low water.
In its classic form, the tidal range is divided into twelve parts.
Over approximately six equal time intervals, the water is estimated to change by:
First interval: 1/12
Second interval: 2/12
Third interval: 3/12
Fourth interval: 3/12
Fifth interval: 2/12
Sixth interval: 1/12
Together:
1 + 2 + 3 + 3 + 2 + 1 = 12
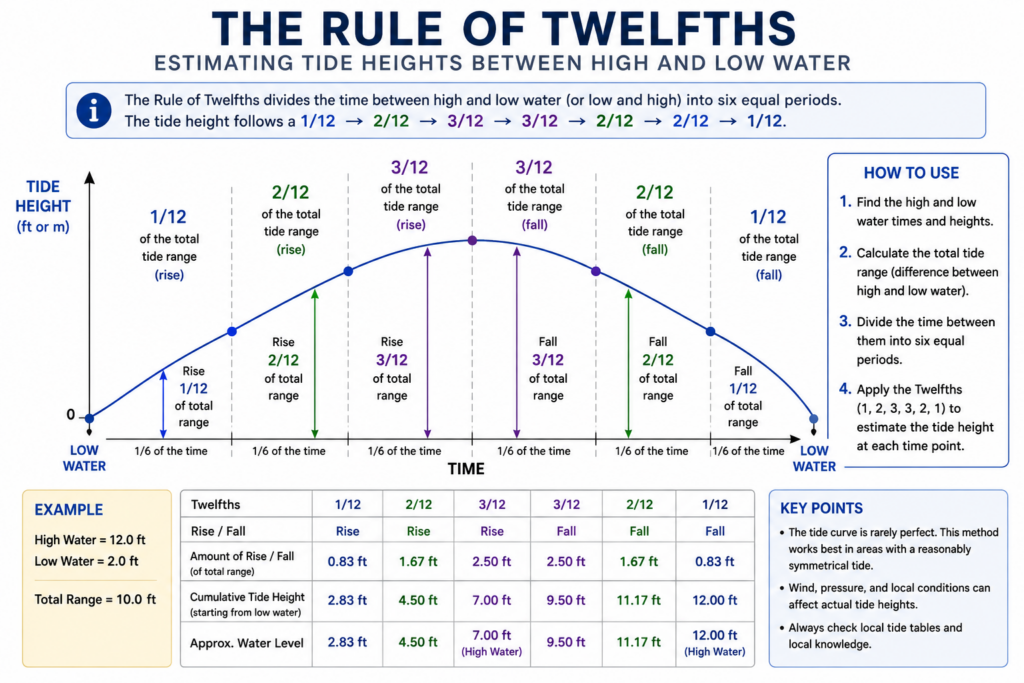
The idea reflects the fact that water level often changes relatively slowly near high and low water and more rapidly through the middle portion of the cycle.
But There Is an Important Limitation
The Rule of Twelfths is an approximation, not a law of nature.
It works best for tidal curves that behave reasonably like the idealized pattern on which the rule is based.
Many locations don’t.
Mixed tides, shallow-water effects and local geography can produce tidal curves that depart substantially from this simple model.
For that reason, don’t force the Rule of Twelfths onto a location where official hourly predictions or a proper tidal curve are available.
Use it to understand the concept—not as an excuse to ignore better information.
Understanding Tidal Range
The difference between high-water height and low-water height is called the tidal range.
If high water is:
4.5 m
and low water is:
1.0 m
the tidal range is:
3.5 m
That means the water surface changes vertically by approximately 3.5 meters between those two predicted events.
Tidal range matters to sailors because a larger range can dramatically change:
- Water depth
- Shoreline position
- Anchorage depth
- Dock height
- Clearance over shoals
- Accessibility of shallow harbors
- The behavior of some tidal currents
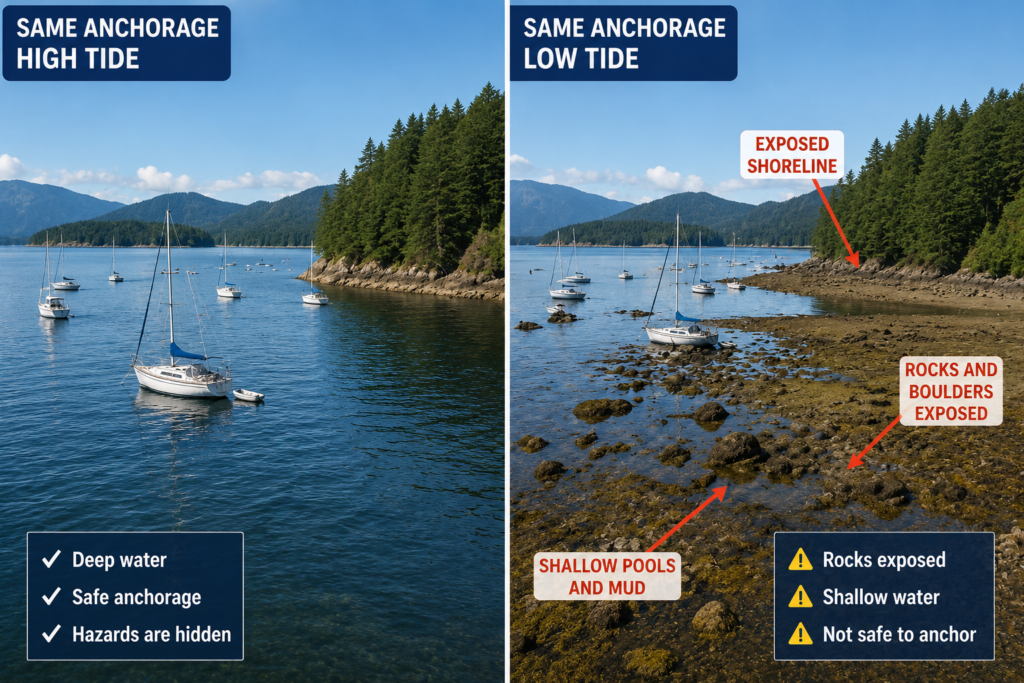
A bay that looks spacious at high water can look remarkably different six hours later.
Spring Tides and Neap Tides
Tidal range doesn’t remain constant throughout the month.
The gravitational influence of the Moon and Sun changes the magnitude of the tides.
Spring Tides
Around the new moon and full moon, the Sun, Moon and Earth are more closely aligned.
Their tidal influences combine to produce generally larger tidal ranges.
These are called spring tides.
The name has nothing to do with the season of spring.
Spring tides typically mean higher high waters and lower low waters than during neap conditions, although actual local behavior varies.
Neap Tides
Around the first and third quarter phases of the Moon, the solar and lunar tidal influences partially oppose one another.
The result is generally a smaller tidal range.
These are called neap tides.
Why Sailors Care
A larger tidal range can mean a greater change in water depth during your sailing day.
It may also be associated with stronger tidal currents in many locations.
That doesn’t mean you need to plan every sail around the phase of the Moon.
It means you should look at the actual predictions rather than assuming yesterday’s tide will simply repeat tomorrow.
Reference Stations and Secondary Stations
Not every harbour has the same quality or type of tidal prediction.
Traditionally, tide publications have distinguished between reference or primary stations and secondary or subordinate stations.
A reference station has predictions associated directly with that station.
For secondary locations, corrections may be provided relative to a reference station.
Those corrections can involve:
- High-water time
- Low-water time
- High-water height
- Low-water height
For example, a secondary harbour might experience high water 20 minutes later than its reference station, with a slightly different predicted height.
The exact correction method depends on the publication and hydrographic authority you’re using.
Don’t invent your own correction simply because two places are geographically close.
Follow the instructions supplied with the official source.
Tide Tables and Current Tables Are Not the Same Thing
This is one of the most important lessons in this article.
Tide describes changes in water level.
Tidal current describes horizontal movement of water.
They are related, but they are not interchangeable.
A tide table might tell you that high water occurs at 13:20.
That does not automatically mean the current stops at 13:20.
Likewise, low water does not automatically mean slack current.
Flood Current
A flood current generally describes tidal current flowing in the direction associated with the incoming or rising tide.
Ebb Current
An ebb current generally describes tidal current flowing in the direction associated with the outgoing or falling tide.
Slack Water
Slack water is a period around the change in tidal-current direction when current speed may become relatively weak before reversing.
Maximum Flood and Maximum Ebb
Current predictions may also give the time and speed of maximum flood and maximum ebb.
These can matter enormously when navigating narrow channels, passes and other areas where tidal currents accelerate.
Beginner Warning: Never assume that high water means slack water. Check current predictions separately whenever current matters to your route.
NOAA, for example, publishes current predictions that identify predicted maximum flood, maximum ebb and slack-current periods at current stations.
Why Tidal Currents Matter to Sailors
Imagine your sailboat can comfortably make 5 knots through the water.
You enter a narrow channel with a 3-knot current flowing against you.
Your progress over the bottom can be dramatically reduced.
Now imagine that same current is pushing you toward a rock, shoal or bridge.
Suddenly the current isn’t merely inconvenient.
It is part of the navigation problem.
This is why coastal passage planning often requires checking both tide heights and tidal currents.
A future dedicated SailboatZone guide to tidal currents can explore this subject much more deeply.
Using Tide Tables to Avoid Running Aground
For many beginners, this is where tide tables become immediately practical.
Imagine your chart shows a shallow area along your route.
At chart datum, the charted depth is only:
1.4 m
Your sailboat draws:
1.7 m
At the charted depth alone, you wouldn’t have enough water.
But suppose the height of tide at your planned arrival is approximately:
2.2 m
Estimated depth:
1.4 + 2.2 = 3.6 m
Approximate under-keel clearance:
3.6 − 1.7 = 1.9 m
Now the situation looks very different.
This doesn’t mean you should automatically proceed.
It means the tide calculation has given you useful information for making the decision.
Rising Tide or Falling Tide: Does It Matter?
Very much.
Suppose you need to cross a shallow area.
You calculate adequate water beneath the keel, but only with a modest safety margin.
Now consider two situations.
Situation A: The Tide Is Rising
If you encounter slightly less water than expected, waiting may improve the situation as the water continues to rise.
Situation B: The Tide Is Falling
If you encounter less water than expected, the situation may continue to deteriorate.
If you touch bottom on a falling tide, the boat may become increasingly grounded as the water recedes.
This doesn’t mean “rising tide equals safe” or “falling tide equals dangerous.”
It means the direction of change matters.
A good sailor thinks not only about how much water is available now, but also about what the water is going to do next.
Using Tide Tables When Entering or Leaving a Harbour
Harbour entrances are one of the most common places where beginners encounter practical tide planning.
Before entering or leaving a shallow harbour, consider:
- The shallowest charted depth
- Your boat’s draft
- Predicted height of tide
- Whether the tide is rising or falling
- Tidal current
- Waves or swell
- Local notices and hazards
- Your safety margin
A harbour that is easily accessible at high water may be unsuitable for your boat around low water.
Likewise, a narrow entrance may have adequate depth but difficult current.
Depth and current are separate questions.
Check both.
Using Tide Tables When Anchoring
Tides also matter after you’ve stopped sailing.
Imagine you enter an anchorage at low water.
Your depth sounder reads:
4 m
You drop your anchor, calculate your scope and settle in for the evening.
But the tide is going to rise another 4 meters overnight.
Your boat may soon be floating in approximately:
8 m of water.
That additional depth changes the geometry of your anchor rode.
If you calculated how much rode to deploy using only the depth when you arrived, you may have substantially less scope at high water than you intended.
This is why anchoring calculations should consider the maximum expected water depth while you’re anchored, not simply the depth when the anchor hits bottom.
The opposite problem also matters.
If you anchor near a shoal, rock or shoreline at high water, those hazards may become much closer—or emerge completely—as the tide falls.
Weather Can Change the Actual Water Level
Tide predictions are based primarily on predictable astronomical forces.
The ocean, however, doesn’t exist in a laboratory.
Weather can change the water level you actually encounter.
Atmospheric Pressure
Changes in atmospheric pressure can influence sea level.
Wind
Persistent strong wind can push water toward or away from a coastline or into and out of bays.
Storms
Storm surge and other meteorological effects can significantly alter water levels.
Waves
Even if the average water depth is adequate, a boat moving through waves may experience changing clearance beneath the keel.
These effects are another reason not to treat a predicted tide height as an exact guarantee.
When your safety depends on a very small margin, build uncertainty into your decision.
Using Tide Apps and Chartplotters
Most sailors today will encounter tide information digitally.
Modern chartplotters and navigation apps may display:
- High and low water
- Tidal curves
- Hourly water-level predictions
- Tide direction
- Tide stations
- Current stations
- Current speed and direction
This makes tide planning much easier.
It can also create false confidence.
Before relying on a digital tide display, check:
Which station am I viewing?
What date is displayed?
What units are being used?
What time zone is being used?
Is this tide height or tidal current?
Where did the prediction data come from?
A polished graph doesn’t automatically mean you’re looking at the right information.
Use Reliable Tide Information
Whenever water depth or tidal current affects the safety of your passage, use authoritative information appropriate to the waters you’re navigating.
For Canadian waters, the Canadian Hydrographic Service (CHS) provides official tide, current and water-level information, including station predictions and Canadian Tide and Current Tables. Its online services provide tidal and water-level station information as well as current predictions.
For sailors in the United States, NOAA Tides & Currents provides official U.S. high and low tide predictions along with current and water-level information.
If you’re sailing elsewhere, use the appropriate national hydrographic authority or other authoritative source for that region.
Planning a Simple Sailing Trip Using Tide Tables
Let’s put everything together.
Suppose you’re planning a day sail.
Your sailboat draws:
1.8 m
You plan to:
- Leave your marina at 09:00
- Cross a shallow harbour entrance
- Sail to a nearby anchorage
- Have lunch
- Return around 17:00
The shallowest charted depth in the harbour entrance is:
1.3 m
Your simplified tide table shows:
| Time | Event | Height |
|---|---|---|
| 06:20 | Low | 0.9 m |
| 12:25 | High | 4.2 m |
| 18:35 | Low | 1.2 m |
Departure
At 09:00, the tide is rising.
You would obtain or estimate the predicted height of tide for approximately 09:00 using the appropriate official prediction data.
Suppose it is approximately:
2.5 m
Estimated depth over the shallowest charted point:
1.3 + 2.5 = 3.8 m
Subtract your draft:
3.8 − 1.8 = 2.0 m
You have an estimated 2.0 meters of under-keel clearance at that location.
At the Anchorage
Before dropping anchor, you check the tidal range during your stay.
Because you’re approaching high water, you know the water may become shallower later in the afternoon.
You therefore consider both the depth required for adequate anchoring scope and the clearance you’ll have as the tide falls.
Returning Home
This is where beginners sometimes get caught.
You passed through the harbour entrance comfortably in the morning.
That does not mean you’ll have the same depth when you return.
By 17:00, the tide is falling toward a 1.2 m low at 18:35.
You need to calculate the available water again for your expected return time.
The morning calculation doesn’t come home with you.
Conditions have changed.
That is the essence of tidal passage planning:
Don’t ask only, “Can I get through?”
Ask:
“Can I get through when I expect to be there—and what will the tide be doing afterward?”
Common Tide Table Mistakes Beginners Make
Most tide-table mistakes aren’t caused by difficult mathematics.
They’re caused by overlooking something simple.
1. Looking at the Wrong Date
Always confirm the date before using the numbers.
2. Using the Wrong Tide Station
Nearby doesn’t necessarily mean identical.
3. Mixing Feet and Metres
Check the units on both your chart and tide information.
4. Ignoring the Time Zone
An hour can matter enormously when water depth is changing quickly.
5. Confusing Tide Height With Water Depth
A 3 m tide does not mean the water is 3 m deep.
6. Forgetting Chart Datum
Understand the reference used before combining charted depths and tidal heights.
7. Assuming the Tide Changes at a Constant Rate
It generally doesn’t.
8. Treating the Rule of Twelfths as Exact
It is an approximation.
9. Assuming High Tide Means Slack Water
Tide height and tidal current are related but different phenomena.
10. Forgetting Your Boat’s Draft
Water depth isn’t useful until you compare it with how far your boat extends below the surface.
11. Using Arrival Depth for the Entire Anchorage Stay
Consider the highest and lowest expected water levels during the entire time you’ll be anchored.
12. Treating a Prediction as a Guarantee
Weather and local conditions can change actual water levels.
A Beginner’s Tide-Planning Routine
Before a coastal sail where tides matter, work through the same routine every time.
1. Select the correct tide station.
Confirm that the station is appropriate for the area you’re navigating.
2. Confirm the date.
Make sure you’re using predictions for the correct day.
3. Check the units and time zone.
Know exactly what the numbers represent.
4. Identify high and low waters.
Note their times and predicted heights.
5. Determine whether the tide will be rising or falling.
Think about what happens before and after your planned arrival.
6. Determine the predicted height of tide at the time you need it.
Use official hourly predictions or an appropriate calculation method.
7. Check the nautical chart.
Find the shallowest relevant charted depth.
8. Estimate actual water depth.
Charted depth + height of tide ≈ estimated water depth.
9. Account for your boat’s draft.
Estimated water depth − draft = approximate under-keel clearance.
10. Add an appropriate safety margin.
Don’t plan to use every centimeter your calculation suggests is available.
11. Check tidal-current information separately.
Especially when navigating narrow channels, passes or harbour entrances.
12. Consider weather and actual conditions.
Finally, compare your prediction with what you can observe.
Tide Tables Become Easier With Practice
At first, tide tables can feel like one more collection of numbers that a beginner sailor is expected to understand.
But the basic process is surprisingly simple.
Start with three questions:
When is high and low water?
How high is the water predicted to be when I need it?
What does that mean for the depth beneath my boat?
Once you can answer those questions, the tide table stops being an abstract table and starts becoming a navigation tool.
Then you can add the next layers: tidal range, anchoring depth, tidal currents, harbour entrances and passage timing.
This is also where several sailing skills begin to connect.
Your nautical chart tells you about the shape and depth of the waterway.
Your tide table tells you how the water level is expected to change.
Your current information tells you how the water itself may be moving.
Your depth sounder tells you what is actually beneath the boat.
Your eyes tell you what is happening around you right now.
Good seamanship comes from putting those sources together rather than trusting any single one blindly.
Key Takeaways
- Tide tables predict the time and height of high and low water.
- Tide height is not the same thing as water depth.
- Always confirm the station, date, time zone and units.
- Chart datum connects tide information with charted depths.
- A useful basic relationship is charted depth + height of tide ≈ estimated water depth, when compatible datums are being used.
- Subtract your boat’s draft to estimate under-keel clearance.
- The water doesn’t normally rise and fall at a constant rate.
- The Rule of Twelfths is an approximation, not a universal rule.
- Spring tides generally produce larger tidal ranges than neap tides.
- Tide height and tidal current are not the same thing.
- High water does not automatically mean slack current.
- Anchoring calculations should account for changing water depth throughout your stay.
- Weather can cause actual water levels to differ from predictions.
- Tide predictions should be combined with charts, current information, depth sounder readings, observations and prudent safety margins.
Test Your Knowledge: Tide Tables Quiz
1. What two main pieces of information does a basic tide table provide?
A. Wind speed and direction
B. Time and predicted tide height
C. Boat speed and water depth
D. Current speed and direction
2. A tide table shows low water at 06:00 and high water at 12:15. At 09:00, is the water generally rising or falling?
A. Rising
B. Falling
C. Slack
D. Impossible to determine
3. A tide table predicts a height of 3.2 m. Does that mean the water is 3.2 m deep?
A. Yes
B. No
4. Your chart shows a depth of 2.0 m and the predicted height of tide is 2.8 m. Assuming compatible datums, what is the approximate water depth?
A. 0.8 m
B. 2.4 m
C. 4.8 m
D. 5.6 m
5. Your estimated water depth is 4.8 m and your sailboat draws 1.8 m. What is your approximate under-keel clearance?
A. 1.8 m
B. 2.0 m
C. 3.0 m
D. 6.6 m
6. What is tidal range?
A. The distance a tidal current travels
B. The difference between high- and low-water heights
C. The distance between two tide stations
D. The time between sunrise and high tide
7. What does the Rule of Twelfths attempt to estimate?
A. Boat speed
B. Tidal current direction
C. Change in tidal height between high and low water
D. Wave height
8. Is the Rule of Twelfths exact?
A. Yes
B. No
9. Spring tides generally produce:
A. Smaller tidal ranges
B. Larger tidal ranges
C. No tides
D. Exactly twelve hours between high and low water
10. Does high water necessarily occur at the same time as slack current?
A. Yes
B. No
11. Why should a sailor check the tide for the return trip as well as the departure?
A. The boat’s draft changes
B. Chart datum changes during the day
C. Water depth may be very different later
D. Nautical charts expire every six hours
12. When anchoring, which water depth should you consider when determining the amount of rode required?
A. Only the depth when you arrive
B. Only low-water depth
C. The expected depth throughout your stay, including maximum relevant depth
D. The depth printed on your depth sounder when you leave
13. Why might actual water level differ from the tide-table prediction?
A. Wind and atmospheric conditions can affect water level
B. Tide tables measure boat draft
C. Nautical charts change the Moon’s gravity
D. They cannot differ
14. What four things should you check before using numbers from a tide table?
A. Boat color, sail area, engine size and fuel level
B. Station, date, time reference and units
C. Latitude, longitude, compass and speed
D. Wind, clouds, temperature and visibility
15. Your chart shows 1.6 m over a shoal. The predicted height of tide is 2.7 m. Your boat draws 1.9 m. Approximately how much under-keel clearance does the calculation suggest?
A. 0.8 m
B. 1.6 m
C. 2.4 m
D. 4.3 m
Tide Tables Quiz Answer Key
1. B — Time and predicted tide height
A basic tide table primarily tells you when high and low water are predicted and their heights.
2. A — Rising
The time falls between low water and the next high water.
3. B — No
Tide height is measured relative to a specified datum. It is not the same thing as total water depth.
4. C — 4.8 m
2.0 m charted depth + 2.8 m tide height = approximately 4.8 m of water.
5. C — 3.0 m
4.8 m water depth − 1.8 m draft = approximately 3.0 m under-keel clearance.
6. B — The difference between high- and low-water heights
That vertical difference is the tidal range.
7. C — Change in tidal height between high and low water
The Rule of Twelfths is a traditional approximation for estimating how tidal height may change during a reasonably regular tidal cycle.
8. B — No
It is only an approximation and can be inappropriate where tidal curves are irregular.
9. B — Larger tidal ranges
Spring tides generally occur around new and full moons and tend to produce larger tidal ranges.
10. B — No
Tidal height and tidal current are different. Check current predictions separately.
11. C — Water depth may be very different later
A passage that has plenty of water in the morning may be considerably shallower when you return.
12. C — The expected depth throughout your stay, including maximum relevant depth
Your anchoring plan should account for changing water level.
13. A — Wind and atmospheric conditions can affect water level
Tide tables are predictions and actual water levels can differ.
14. B — Station, date, time reference and units
Checking these four items prevents several common and potentially serious errors.
15. C — 2.4 m
Estimated water depth:
1.6 + 2.7 = 4.3 m
Then subtract the boat’s draft:
4.3 − 1.9 = 2.4 m approximate under-keel clearance.