A nautical chart can look intimidating the first time you open one.
There are numbers scattered across the water, strange symbols near the shoreline, colored areas, dashed lines, compass roses, abbreviations, buoys, lights, rocks, wrecks and notes seemingly everywhere.
At first glance, it can feel as though you need to memorize an entirely new language before you can use one.
You don’t.
Learning how to read a nautical chart is much easier when you understand what the chart is trying to tell you.
A nautical chart is essentially a picture of the sailing environment. It shows you where the water is deep, where it becomes shallow, where hazards may exist, where navigation aids are located and how you can move from one place to another more safely.
You don’t need to understand every symbol on the chart before you begin using one.
Instead, start with the information most relevant to a small cruising sailboat:
- Where am I?
- Where am I going?
- How deep is the water?
- What hazards are between here and there?
- What navigation aids can help me?
- How far is the trip?
- Will tide affect the depths?
- Is there anything overhead that my mast cannot pass beneath?
By the end of this guide, you should be able to look at a real paper or electronic nautical chart, understand its major information, recognize obvious hazards, estimate available water depth and use the chart to begin planning a simple coastal passage.
About this Guide
Written by Kelly Hiebert, a recreational sailor since 2002 and a middle-school teacher. Kelly created Sailboat Zone to provide beginners with clear, structured sailing education.
Last reviewed: September 2026
Jurisdiction: This guide explains general nautical-chart concepts using Canadian Hydrographic Service conventions. Symbols, buoyage systems, datums, units and chart-carriage requirements vary by country, vessel and voyage. In Canadian waters, use current official charts and publications appropriate to your route and keep them corrected with applicable Notices to Mariners.
Primary sources:
- Canadian Hydrographic Service — Canadian Chart 1: Symbols, Abbreviations and Terms
- Canadian Hydrographic Service — How to Read Your Paper Charts
- Canadian Hydrographic Service — Nautical Charts and Services
Safety note: A nautical chart is an essential navigation tool, but it does not guarantee safe water or show every current hazard. Use the current, largest-scale official chart appropriate to your route, apply relevant chart updates and Notices to Mariners, and read all cautions and notes. Confirm electronic-chart settings and zoom level, and continuously compare chart information with your position, depth, tides, navigation aids, weather and direct observation.
What Is a Nautical Chart?
A nautical chart is a specialized map designed for navigation on the water.
Unlike an ordinary road or topographic map, a nautical chart concentrates heavily on information that matters to mariners.
That includes:
- Water depths
- Shorelines
- Rocks
- Reefs
- Shoals
- Wrecks
- Navigation channels
- Buoys
- Beacons
- Lighthouses
- Anchorages
- Bridges
- Overhead cables
- Tidal information
- Restricted areas
- Harbour facilities
An ordinary map may show you where an island is.
A nautical chart tries to tell you whether you can safely sail around that island.
That difference is fundamental.
A Nautical Chart Does Not Guarantee Safe Water
One of the first habits new sailors should develop is resisting the temptation to treat a chart as perfect.
Charts represent the best available hydrographic information, but that information may come from surveys conducted at different times and with different technologies.
A chart also cannot tell you about everything happening right now.
Floating logs, temporary construction, fishing gear, drifting debris, recently shifted sand or gravel, vessels at anchor and temporary navigation hazards may not appear.
Therefore, chart navigation should be combined with:
- Looking outside the boat
- Depth sounder information
- GPS
- Tide information
- Weather information
- Notices and navigation warnings
- Local knowledge when appropriate
- Good seamanship
A chart is an extraordinarily useful tool.
It isn’t a substitute for situational awareness.
Paper Charts and Electronic Charts
Traditional navigation uses printed paper charts.
Many modern sailors now navigate primarily with:
- Chartplotters
- multi-function displays
- Tablets
- Phones
- Navigation software
The underlying navigation concepts remain largely the same.
Depths still matter.
Rocks still matter.
Latitude and longitude still matter.
Scale still matters.
The biggest difference is how the information is displayed and manipulated.
Raster and Vector Electronic Charts
Electronic charts generally fall into two broad categories.
A raster chart is essentially a digital image of a traditional paper chart.
Zoom in and you’re magnifying that image.
A vector chart stores individual chart features as data. Your chartplotter can therefore display, hide, highlight or reorganize information depending on your settings and zoom level.
Vector charts can be extremely powerful, but they introduce an important beginner danger:
Information may appear or disappear depending on the display settings and chart scale.
We’ll return to that later.
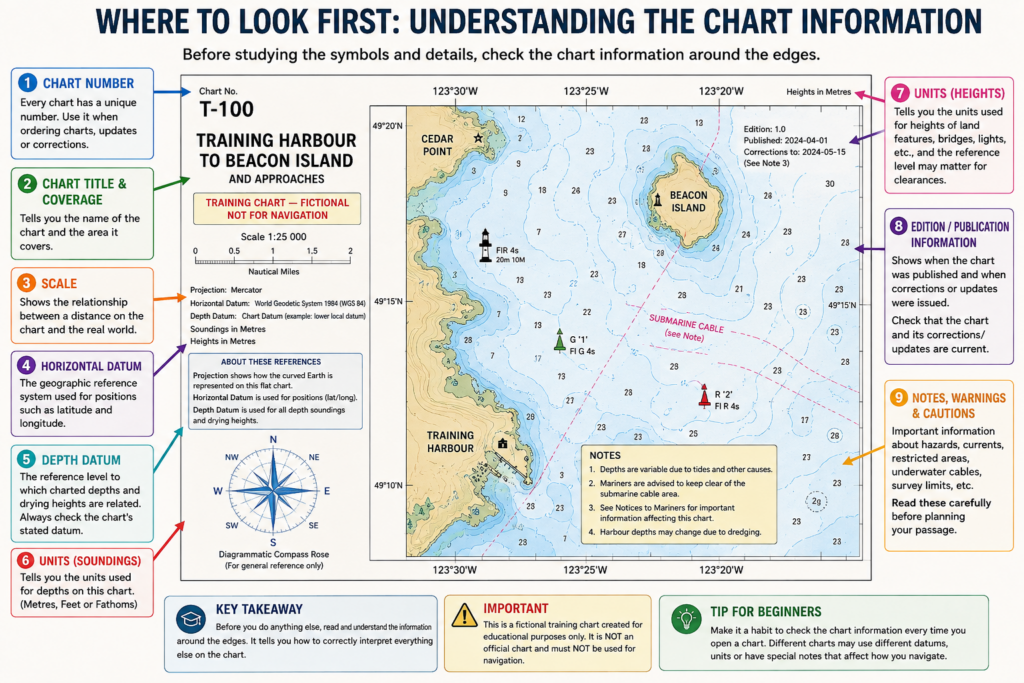
Start With the Chart Information — Not the Symbols
When beginners open a nautical chart, their eyes often immediately jump toward the rocks, numbers and colored areas.
Before doing that, determine what chart you’re actually looking at.
Depending on the chart and format, important information may include:
- Chart number
- Chart title
- Geographic coverage
- Scale
- Horizontal datum
- Depth datum
- Sounding units
- Height units
- Edition information
- Publication information
- Warnings
- Cautions
- Special notes
These details provide the framework needed to interpret everything else correctly.
Chart Number and Name
Every official chart covers a defined geographic area and normally has an identifying number.
You need to know whether the chart you’re using actually covers the waters in which you plan to sail.
Units Matter
Never assume every chart uses the same depth units.
Depending on the chart, depths may be represented in:
- Metres
- Feet
- Fathoms
Imagine seeing the number 3 near your route.
Three meters is very different from three fathoms.
Before interpreting any sounding, verify the units.
Horizontal Datum
The horizontal datum provides the geographic reference system used for positions on the chart.
Modern navigation increasingly uses compatible global positioning reference systems, but the important beginner lesson is simple:
Make sure your GPS position and chart use compatible reference information.
On older charts, mismatched datums can result in plotted positions appearing somewhere other than where they actually are.
Depth Datum
Depth datum is equally important.
Charted depths are referenced to a defined vertical level rather than today’s actual water surface.
That is why tide must eventually enter your calculations.
Read the Notes
Charts often contain important warnings or explanatory notes.
Don’t treat them as decoration.
A note may provide information about:
- Unusual currents
- Restricted navigation
- Survey limitations
- Seasonal buoyage
- Dredging
- Traffic
- Military activity
- Cable areas
- Shoaling
Experienced sailors read the notes because they sometimes reveal information that isn’t obvious from the main chart.
Understanding Nautical Chart Scale
Chart scale is one of the most frequently misunderstood chart concepts.
Imagine two charts.
One shows the entire west coast of Vancouver Island.
Another shows only one harbour.
Which one contains more harbour detail?
Usually the harbour chart.
That harbour chart is described as the larger-scale chart.
Large Scale vs Small Scale
This terminology can seem backward at first.
A large-scale chart covers a relatively small geographic area in greater detail.
A small-scale chart covers a much larger geographic area with less detail.
For example:
1:10,000 is a larger scale than 1:500,000.
On the 1:10,000 chart, objects can be shown with far greater detail.
Different Charts for Different Jobs
You might use:
- A general chart to understand a broad region
- A coastal chart while traveling along a coastline
- An approach chart as you get closer to a harbour
- A harbour chart for entering the harbour itself
The closer you get to hazards, shorelines and narrow passages, the more important detailed large-scale charts become.
Electronic Zoom Can Be Misleading
On an electronic chart, you can pinch or turn a knob and zoom toward the marina.
That does not necessarily mean the underlying hydrographic data suddenly becomes more detailed.
You may simply be enlarging information originally intended for a smaller scale.
This distinction becomes particularly important when navigating close to hazards.
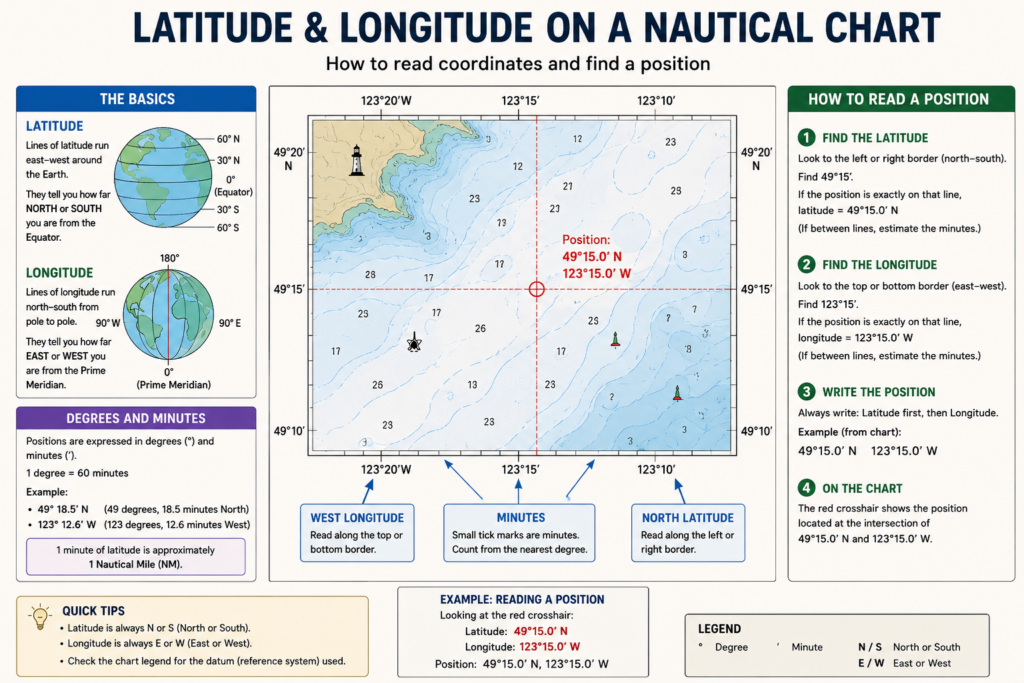
Understanding Latitude and Longitude
Latitude and longitude give every location on Earth a geographic address.
They form the coordinate system mariners use to describe positions.
Latitude
Lines of latitude run roughly east-west around the Earth.
They measure how far north or south you are from the equator.
Latitude is expressed in:
- Degrees
- Minutes
- Fractions or decimals of minutes
For example:
49° 18.5′ N
means 49 degrees and 18.5 minutes north latitude.
Longitude
Longitude lines run from pole to pole.
Longitude measures position east or west of the prime meridian.
An example might be:
123° 12.6′ W
Reading Coordinates From a Chart
Latitude markings are normally found along the left and right borders of a chart.
Longitude is read along the upper and lower borders.
If you know the coordinates of a position, you can transfer those coordinates onto the chart.
Likewise, if you identify a position on the chart, you can determine its approximate latitude and longitude from the borders.
Why Latitude Is Especially Useful to Sailors
One minute of latitude represents approximately one nautical mile.
That creates a very convenient relationship between position and distance.
1 minute of latitude ≈ 1 nautical mile.
That relationship is why chart dividers are commonly transferred to the latitude scale when measuring distance.
Why Not Use Longitude for Distance?
The physical distance represented by a minute of longitude changes depending on latitude.
Longitude lines converge as they approach the poles.
Therefore, for traditional chart work, distance is generally measured against the chart’s latitude scale, not its longitude scale.
Measuring Distance on a Nautical Chart
Once you understand latitude, measuring distance becomes straightforward.
Distances at sea are normally expressed in nautical miles, abbreviated NM.
One nautical mile is approximately 1,852 meters.
Speed at sea is generally expressed in knots.
One knot means one nautical mile per hour.
Using Dividers
On a paper chart, navigators commonly use a pair of dividers.
Place one point at the beginning of the distance you want to measure and the other at the destination.
Then move the dividers to the latitude scale near the area being measured.
The number of minutes of latitude between the divider points gives you approximately the number of nautical miles.
Short and Long Distances
For a short passage, you may be able to measure the entire distance at once.
For a winding or longer route, divide the route into several legs and add them together.
Distance and Time
Once you know distance, you can estimate travel time.
The basic relationship is:
Time = Distance ÷ Speed
Suppose your anchorage is 6 NM away and your boat averages 5 knots.
6 ÷ 5 = 1.2 hours.
That is approximately:
1 hour 12 minutes.
Real sailing speed varies, of course.
Wind, current, maneuvering and sea conditions may make the trip longer or shorter.
But the calculation gives you a useful planning estimate.
Understanding Depth Numbers: Soundings
Those numbers scattered throughout the water are some of the most important information on the chart.
They are called soundings.
A sounding represents a measured water depth referenced to the chart’s depth datum.
If you see:
4.2
the chart may be telling you that the charted depth at that location is 4.2 meters — assuming the chart uses meters.
Always verify the units first.
Spot Soundings
Individual depth measurements are sometimes called spot soundings.
They show depth at specific surveyed locations.
Do not assume every centimeter between those points has exactly the same depth.
Depth Contours
Charts also use contour lines to connect areas of similar depth.
You might see contours representing:
- 2 meters
- 5 meters
- 10 meters
- 20 meters
These help you understand how the underwater terrain changes.
Shallow-Water Shading
Charts commonly use colors or shading to distinguish depth zones.
However, colors should be treated as visual assistance rather than your only source of information.
Confirm important depths using:
- Soundings
- Contours
- Chart legend
- Chartplotter settings
Drying Heights
Some areas are underwater during part of the tidal cycle and exposed during another part.
These are often called drying areas.
A drying height indicates how far a feature may stand above the chart datum when exposed.
This is different from an ordinary depth sounding.
Beginners should be particularly careful here because the notation can look deceptively similar.
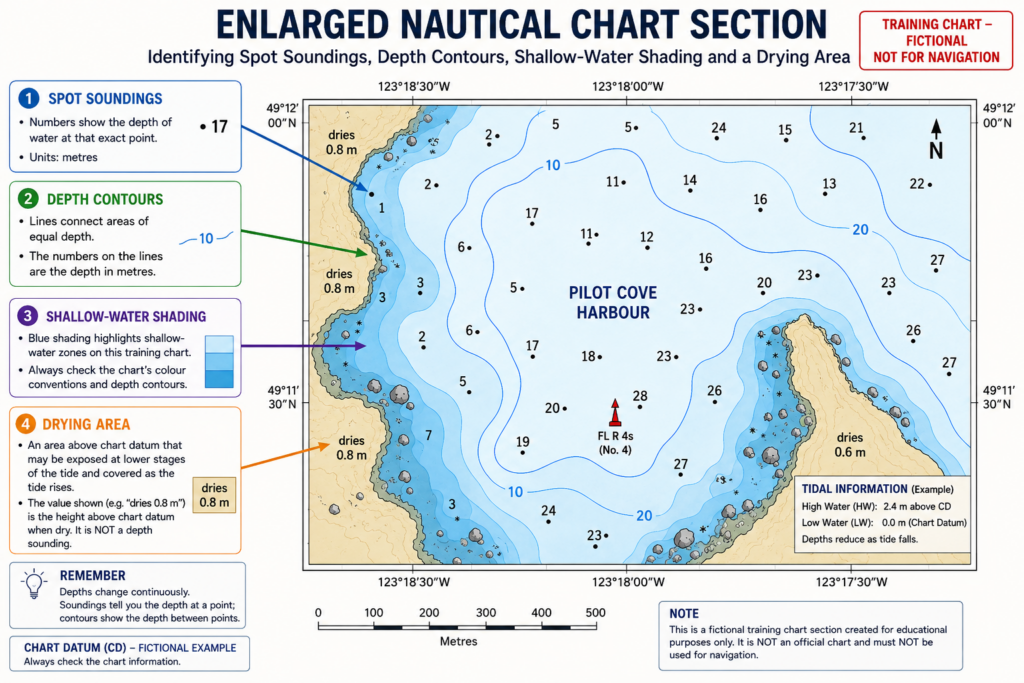
Chart Datum and Tides
Now we reach one of the most important ideas in chart reading:
The depth printed on the chart is not necessarily the depth you’ll have when you sail over that location.
The actual depth varies with the tide.
Chart Datum
Soundings are referenced to a defined vertical level known as chart datum.
Tidal heights are also expressed relative to a reference level.
For beginner passage planning, you can think about the relationship this way:
Expected water depth ≈ charted depth + height of tide
Suppose:
- Charted depth = 2.5 m
- Height of tide = 1.8 m
Then:
Expected water depth ≈ 4.3 m
Now suppose your sailboat draws 1.7 m.
Your approximate under-keel clearance becomes:
4.3 − 1.7 = 2.6 m
So the simplified answer is approximately 2.6 meters beneath the keel.
Don’t Forget Draft
Your boat’s draft is the vertical distance from the waterline to the deepest part of the underwater structure, normally the keel.
Knowing that number is essential.
A chart tells you how much water may be available.
Your draft tells you how much water your boat requires.
Leave a Safety Margin
The simplified calculation above is a useful teaching tool, but actual passage planning requires margin.
Factors that can affect your available clearance include:
- Tidal prediction uncertainty
- Atmospheric pressure
- Wind
- Waves
- Boat loading
- Squat on some vessels
- Survey uncertainty
- Sediment movement
- Depth sounder location and calibration
You should therefore never treat a calculated centimeter of clearance as a guarantee.
Depth Contours Reveal the Underwater Landscape
A beginner often sees chart soundings as a collection of unrelated numbers.
An experienced navigator begins to see a landscape.
That is an important transition.
A nautical chart is essentially a map of terrain you cannot see.
Closely Spaced Contours
Contours close together usually indicate depth changing quickly.
That may mean:
- A steep underwater slope
- A cliff-like shoreline
- A deep channel beside shallow water
Widely Spaced Contours
Contours spread farther apart indicate more gradual changes in depth.
You may be looking at:
- A gradually shelving beach
- A bank
- A broad shallow area
Shoaling Water
If your route progresses from:
20 m → 10 m → 5 m → 3 m
the bottom is rising toward your keel.
This is called shoaling water.
If you aren’t expecting that change, it should attract your attention.
Channels
A deeper ribbon of water surrounded by shallower soundings may reveal a navigable channel.
Banks and Shoals
A bank is an elevated underwater area.
A shoal is shallow water that may present a hazard to navigation.
Chart contours help you recognize their shape before you ever see any effect on the surface.
Understanding Chart Colours
Colours make nautical charts easier to interpret quickly.
However, exact color presentation varies between chart systems, chart publishers, daylight/night modes and electronic display settings.
Depending on the chart, color may help distinguish:
- Land
- Deep water
- Shallow water
- Drying areas
- Intertidal areas
- Special-use areas
The important beginner rule is:
Never navigate by color alone.
Use the color to attract your attention, then interpret the associated:
- Soundings
- Contours
- Symbols
- Labels
- Chart notes
If you’re unsure what a color means, consult the chart legend or official chart-symbol reference.
Rocks, Reefs and Underwater Hazards
For sailors, hazard recognition is one of the most valuable chart-reading skills.
Charts use different symbols to distinguish between hazards with very different characteristics.
Rocks
A rock may be:
- Always above water
- Exposed at some tidal states
- Awash
- Submerged
Those differences matter enormously.
A rock visible at low water might disappear completely as the tide rises.
A submerged rock might never provide any visual warning at all.
Reefs
Reefs may extend well beyond the visible shoreline.
Treat a reef boundary as a hazard area rather than assuming only the center matters.
Shoals
Shoals are shallow areas that may restrict navigation depending on your boat’s draft and the tide.
Obstructions
Charts may show underwater objects that do not fit neatly into another category.
An obstruction should receive the same respect as any other uncertain underwater hazard.
Wrecks
Wrecks may be:
- Visible
- Submerged
- Considered dangerous
- Considered less hazardous at certain depths
Never assume the word “wreck” simply means an interesting dive site.
Check its symbol, depth information and surrounding notes carefully.
Foul Ground
Foul ground indicates an area where the seabed may contain debris, wreckage, rocks, cables or other material that could be dangerous for anchoring or fishing gear.
Breakers
Where a chart indicates breakers, waves may break because of shallow water or underwater hazards.
This deserves attention even if your draft suggests adequate depth.
Unreliable Depths
Some charts identify areas where hydrographic information is incomplete or less reliable.
Treat uncertainty itself as a hazard.
Understanding Seabed Characteristics
A chart can also tell you what lies on the bottom.
You may see abbreviations indicating:
- Sand
- Mud
- Clay
- Gravel
- Rock
- Shell
- Weed
Why would a sailor care?
Because the seabed affects how well your anchor is likely to hold.
An anchor that performs well in sand may behave differently in:
- Weed
- Hard clay
- Rock
- Very soft mud
If you’re planning to stop overnight, bottom composition can be nearly as important as water depth.
Navigation Aids on the Chart
Navigation aids are objects placed or maintained to help mariners determine position and avoid hazards.
Charts may show:
- Lighthouses
- Lighted buoys
- Unlighted buoys
- Beacons
- Daymarks
- Leading marks
- Ranges
- Sector lights
- Fog signals
One principle is especially important:
The chart symbol is not necessarily what the object literally looks like.
The chart tells you the type, characteristics and position of the aid.
You then use that information to identify the actual object on the water.
Lighthouses
Charts may provide information such as:
- Light color
- Flash pattern
- Height
- Nominal range
Buoys
Buoys may mark:
- Channel edges
- Hazards
- Safe water
- Special areas
- Cardinal directions around hazards
Leading Marks and Ranges
Two navigation marks can sometimes be aligned to define a safe course.
When the marks line up visually, your boat is on or near the intended line.
These can be extremely useful when entering channels.
Sector Lights
Some lights display different colors depending on the direction from which you see them.
A change in color may warn that you’re moving away from a safe sector.
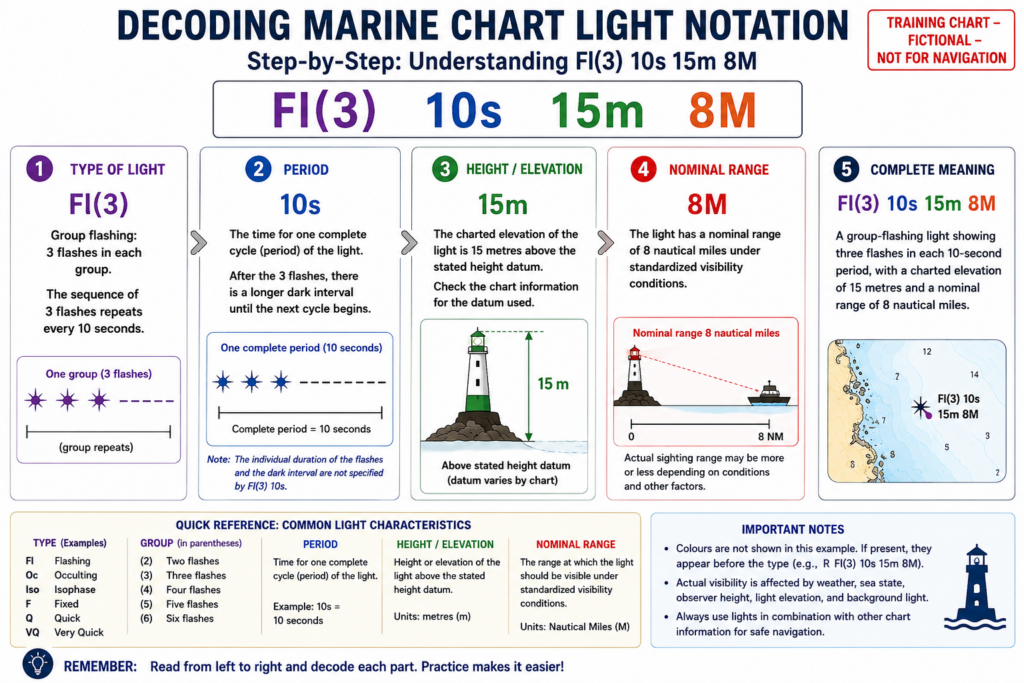
How to Read Light Characteristics
Light descriptions can look cryptic until you learn the pattern.
Imagine a chart displays:
Fl(3) 10s 15m 8M
Let’s break that down.
Fl
Fl means flashing.
The light spends more time dark than illuminated.
(3)
The light flashes in a group of three.
10s
The complete sequence repeats every 10 seconds.
This is the period.
15m
The light is approximately 15 meters above its stated height datum.
8M
Its nominal range is 8 nautical miles under defined visibility conditions.
So rather than seeing an intimidating code, you can interpret the description as something like:
A group of three flashes every ten seconds, with a charted height of 15 meters and nominal range of 8 nautical miles.
Other common light characteristics include:
- F — Fixed
- Fl — Flashing
- Q — Quick
- Oc — Occulting
Colours may also be specified.
A navigator can identify a light at night partly by comparing its observed flash pattern and color with the chart.
Buoys and the IALA Buoyage System
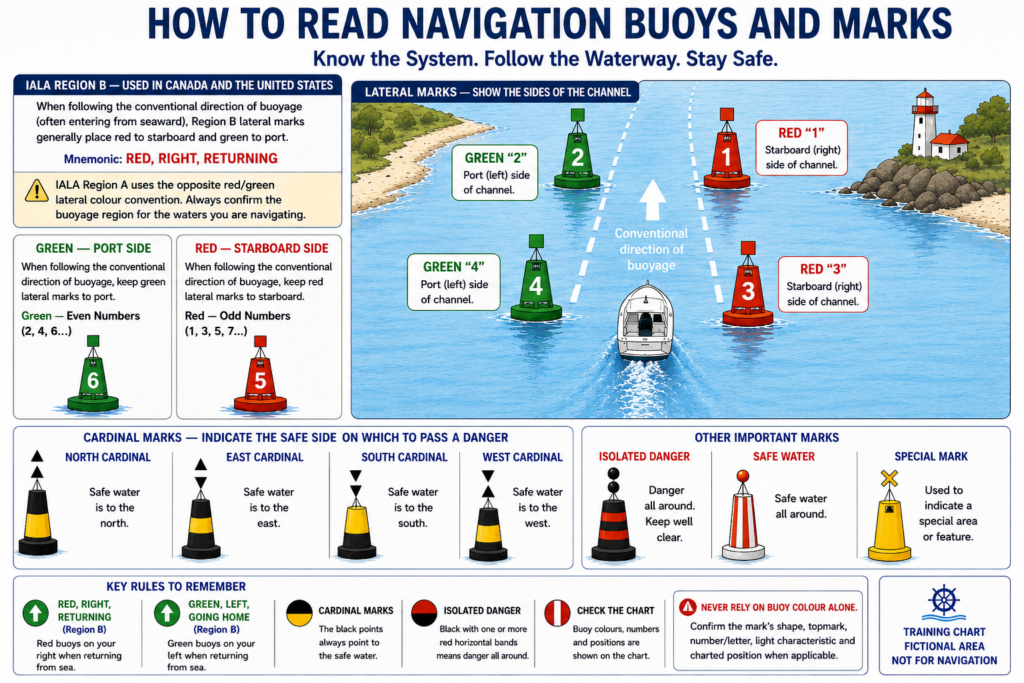
Buoyage is another subject that initially looks more complicated than it is.
Most of the world uses the IALA Maritime Buoyage System.
Canada uses IALA Region B for lateral marks.
This is important because lateral buoy colors differ between Regions A and B.
Lateral Marks
Lateral marks are used primarily to identify the sides of navigable channels.
In Region B, red and green lateral marks indicate different sides of the channel according to the direction of buoyage.
Do not rely only on a memory phrase without understanding which direction you’re traveling.
Preferred-Channel Marks
Where a channel splits, a preferred-channel mark can indicate the primary route.
Its color pattern differs from an ordinary lateral buoy.
Cardinal Marks
Cardinal marks tell you where the safest water lies relative to a hazard.
They are associated with the cardinal directions:
- North
- East
- South
- West
A North Cardinal Mark, for example, indicates that navigable water lies to the north of the mark.
Isolated Danger Marks
These indicate a localized danger with navigable water around it.
Safe-Water Marks
Safe-water marks indicate navigable water around the mark and are often associated with fairways or approaches.
Special Marks
Special marks identify particular areas or features rather than directly showing a channel edge or danger.
Examples can include:
- Recreation areas
- Data collection equipment
- Special-purpose zones
- Cable areas
Compass Roses, True North and Magnetic North
Most traditional nautical charts include one or more compass roses.
A compass rose helps navigators measure direction.
True North
True north points toward the geographic North Pole.
Courses plotted directly on the chart are commonly considered in relation to true north.
Magnetic North
A magnetic compass points approximately toward magnetic north rather than true north.
The angular difference between true north and magnetic north is called variation or magnetic declination.
Variation Changes
Magnetic variation changes gradually over time.
Some charts show:
- Variation for a particular year
- Estimated annual change
This is one reason old magnetic information should not automatically be trusted forever.
For a beginner, you don’t need to master every compass correction immediately.
Start by understanding that:
True direction on the chart and magnetic direction on your compass are not necessarily identical.
Course, Heading and Bearing
These three terms are related but should not be treated as interchangeable.
Course
Your course is the intended direction of travel.
You might draw a course line between two points on your chart.
Heading
Your heading is the direction your boat’s bow is pointing.
Course and heading may differ because of:
- Current
- Wind
- Leeway
Bearing
A bearing is the direction from your position toward another object.
You could take a bearing toward:
- A lighthouse
- Headland
- Buoy
- Tower
- Island
Bearings can help confirm your location.
True and Magnetic Bearings
Directions can be expressed relative to either true north or magnetic north.
Always know which reference you’re using.
Don’t Ignore the Land
Beginners naturally concentrate on the water portion of the chart.
But land features are extremely useful for navigation.
Charts may show:
- Coastlines
- Islands
- Headlands
- Elevations
- Towers
- Chimneys
- Church spires
- Bridges
- Buildings
- Other conspicuous objects
These can help you compare the chart with what you see outside.
Suppose your GPS position shows that you’re approaching a harbour.
You look ahead and see:
- A distinctive headland
- A lighthouse
- A tall tower
If all three match the chart, you have independent evidence supporting your electronic position.
That habit — comparing electronic information with the real world — is excellent seamanship.
Restricted and Special Areas
Not every part of navigable water is available for unrestricted use.
Charts may identify:
- Traffic separation schemes
- Restricted areas
- Prohibited areas
- Military areas
- Marine protected areas
- Anchorage areas
- No-anchoring areas
- Submarine cables
- Pipelines
- Ferry routes
Submarine Cables and Pipelines
These deserve special attention when anchoring.
Dropping an anchor onto a submarine cable or pipeline can be both dangerous and illegal.
If your chart identifies a cable or pipeline area, check the accompanying notes and restrictions before anchoring.
Ferry Routes
A ferry route is not a physical wall in the water.
But it tells you to expect regular commercial traffic.
A slow-moving sailboat should not casually loiter in a high-traffic ferry corridor.
Channels, Harbours and Marina Information
As you approach populated coastal areas, the chart often becomes increasingly dense with information.
You may see:
- Dredged channels
- Channel limits
- Controlling depths
- Breakwaters
- Harbour entrances
- Piers
- Wharves
- Marinas
- Mooring areas
- Anchorages
Dredged Channels
A dredged channel is an area intentionally deepened or maintained for navigation.
Never assume the entire harbour has the same depth as the marked channel.
Breakwaters
Breakwaters protect harbours from waves.
They can also create substantial hazards if approached from the wrong side or too closely.
Anchorages
A charted anchorage may indicate an area commonly used or designated for anchoring.
It does not automatically guarantee:
- Good holding
- Protection from weather
- Sufficient swinging room
- Adequate depth for your boat
You still have to evaluate those factors.
Bridges and Overhead Clearances
Sailors often focus so heavily on what lies beneath the keel that they forget what lies above the mast.
A sailboat can have plenty of water beneath it and still be unable to pass beneath a bridge or overhead cable.
Charts may indicate:
- Bridge location
- Vertical clearance
- Horizontal clearance
- Overhead power cables
- Other overhead obstructions
Know Your Mast Height
You need to know your boat’s approximate maximum height above the water.
Include:
- Mast
- Masthead instruments
- Antennas
- Wind instruments
- Lights
- Other equipment
If your mast is 15 meters above the water and the bridge clearance is 14.5 meters, that is not an invitation to see how accurate your measurements are.
Clearance Datum
Just as soundings relate to a vertical datum, overhead clearances may be referenced to a defined water level.
Tide may therefore affect your available clearance.
Read the chart notes carefully.
Chart Symbols and Abbreviations
There are far too many nautical chart symbols for a beginner to memorize all at once.
You don’t need to.
Professional and experienced recreational navigators still look up unfamiliar symbols.
The important skill is knowing that a reference exists and using it when uncertain.
For Canadian waters, sailors should become familiar with official chart-symbol information provided through the Canadian Hydrographic Service and related Canadian navigation publications.
Chart references explain:
- Symbols
- Abbreviations
- Lines
- Colours
- Navigation aids
- Hazards
- Bottom characteristics
- Special areas
If you encounter a symbol you don’t recognize, don’t guess.
Look it up.
That habit alone will prevent many chart-reading errors.
Electronic Charts and Chartplotters
Electronic navigation has transformed recreational boating.
A chartplotter can display your GPS-derived position directly over a nautical chart.
That is tremendously useful.
But beginners should understand what the system is actually doing.
GPS Position Overlay
Your receiver calculates a geographic position.
The chartplotter then places a boat icon at that coordinate on the electronic chart.
That can create an illusion of perfect certainty.
Avoid that mindset.
Think of it this way:
GPS tells you where the receiver thinks you are.
The chart tells you what should be around you.
Your eyes, instruments and judgement help determine what is actually happening.
Chartplotter Layers
Vector charts can allow you to display or hide information such as:
- Depth soundings
- Navigation aids
- Names
- Boundaries
- Wrecks
- Light information
- Routes
- Waypoints
Settings matter.
Safety Depth
Many chartplotters allow you to set safety-depth or contour information based on your vessel.
Use these settings carefully and understand exactly what they affect.
Do not assume a colored display automatically guarantees safe water.
Waypoints and Routes
Electronic systems make it easy to create routes.
That convenience creates another beginner trap:
A straight line created by the chartplotter is not automatically a safe route.
You must inspect the entire path between waypoints.
The Danger of Over-Zooming
Suppose you’re looking at a coastal chart on your chartplotter.
You zoom farther and farther in.
Eventually the harbour fills the entire screen.
It feels as though you now have an extremely detailed harbour chart.
Maybe you do.
Maybe you don’t.
Overscaling
If the underlying chart data isn’t intended for that zoom level, you may be overscaling it.
You’re magnifying information beyond its intended scale.
The picture becomes bigger.
The underlying survey information does not become more accurate.
Detail May Appear or Disappear
Electronic systems can change what is displayed based on:
- Zoom level
- Decluttering
- Display mode
- User settings
A feature hidden at one zoom level may appear at another.
Before following a route, inspect it at suitable scales.
Zoom both in and out.
Look specifically for:
- Rocks
- Wrecks
- Shoals
- Restricted areas
- Cables
- Depth changes
Chart Accuracy, Surveys and Uncertainty
A modern electronic chart can look astonishingly precise.
Your vessel icon may appear within a metre-sized position on the screen.
That does not mean every feature on the chart is known to the same precision.
Charts are based on hydrographic surveys.
Some waters have been surveyed recently using sophisticated equipment.
Other areas may rely partly on older survey data.
Survey Quality Varies
Uncertainty may involve:
- Water depth
- Exact rock position
- Coastline position
- Seabed shape
- Uncharted features
Remote areas deserve particular respect.
Don’t Navigate by Pixels
If your chartplotter shows your vessel passing six meters from a rock, don’t treat that little gap on the screen as a comfortable safety margin.
Give hazards generous clearance whenever possible.
Navigation should be conservative rather than mathematically heroic.
Chart Updates and Notices to Mariners
The marine environment changes.
Charts therefore need updates.
Changes may involve:
- Buoy positions
- New hazards
- Dredging
- Construction
- Wrecks
- Navigation lights
- Harbour changes
- Restricted areas
- Navigation warnings
Electronic charts may be updated digitally.
Paper charts may require corrections or replacement.
Canadian sailors should become familiar with official Canadian Hydrographic Service chart information and Notices to Mariners.
Before a significant passage, particularly somewhere unfamiliar, ask:
Is my navigation information current?
Planning a Simple Coastal Route
Now let’s combine everything we’ve learned.
Suppose you’re planning to sail from a small harbour to an anchorage several miles away.
Don’t simply drop a waypoint at the anchorage and press “Go.”
Work through the trip deliberately.
Step 1: Identify Your Departure Point
Find your harbour.
Examine:
- Harbour entrance
- Channel
- Breakwaters
- Buoys
- Shallow areas
Step 2: Identify Your Destination
Locate the anchorage.
Look at:
- Depth
- Bottom type
- Protection
- Nearby hazards
- Restricted areas
Step 3: Examine the Water Between Them
Trace a rough route with your eyes.
Look for:
- Rocks
- Shoals
- Wrecks
- Islands
- Reefs
- Cables
- Traffic routes
Step 4: Check Depth
Follow the depth contours along the proposed route.
Compare those depths with your boat’s draft.
Step 5: Consider Tide
Determine whether tide materially changes:
- Under-keel clearance
- Harbour entry
- Channel depth
- Overhead clearance
Step 6: Choose Waypoints
Place waypoints in safe water.
Do not place them directly beside hazards just because the GPS can theoretically steer accurately.
Give yourself room.
Step 7: Measure Distance
Measure each leg.
Estimate total distance.
Step 8: Estimate Travel Time
If the passage is 12 NM and you expect to average 5 knots:
12 ÷ 5 = 2.4 hours.
That’s approximately 2 hours 24 minutes before adding maneuvering or other delays.
Step 9: Identify Navigation Aids
Look for aids that can help confirm your position during the trip.
Step 10: Identify an Alternate Plan
Ask:
- Where could I stop if weather worsens?
- Can I turn around?
- Is there another harbour?
- Is there a safer route?
Good passage planning includes options.
A Complete Beginner Chart-Reading Exercise
Imagine you’re sailing from Harbour A to Anchorage B.
You open the chart.
Before drawing a route, start interpreting what you see.
First: The 3-Metre Contour
A 3 m depth contour curves across part of your route.
Your boat draws 1.7 m.
That doesn’t automatically mean the area is safe or unsafe.
You need to consider:
- Soundings inside the contour
- Tide
- Safety margin
- Waves
- Survey uncertainty
Second: A Submerged Rock
A rock symbol appears near the most direct line between the harbour and anchorage.
You could save a few minutes by passing close to it.
Don’t.
Alter the route to give it generous clearance.
Third: A Lighthouse
A lighthouse lies on the headland.
Its position and light characteristic give you a useful visual reference.
Fourth: A Lateral Buoy
The harbour entrance is marked by lateral navigation aids.
Interpret them according to the applicable buoyage system.
Fifth: A Channel
A narrow deeper channel runs through shallower water.
Your route should keep you within the safe portion of that channel while allowing for traffic.
Sixth: A Wreck
A wreck lies farther offshore.
Check:
- The wreck symbol
- Available depth
- Whether it is considered dangerous
- Nearby soundings
Seventh: A Submarine Cable
A cable crosses near the destination.
Do not plan to anchor over the cable area.
Eighth: The Anchorage
The chart suggests reasonable depth and indicates suitable bottom characteristics.
You still need to assess:
- Weather
- Wind
- Swell
- Swinging room
- Other boats
Ninth: Distance
Using the latitude scale, your planned route measures 7.5 NM.
At 5 knots:
7.5 ÷ 5 = 1.5 hours.
Approximately 90 minutes.
Tenth: Tide
Your shallowest charted point is 2.8 m.
If the tide is expected to add 1.4 m:
2.8 + 1.4 = 4.2 m expected depth.
If your boat draws 1.7 m:
4.2 − 1.7 = approximately 2.5 m beneath the keel before considering other factors.
Now you’re not merely looking at a chart.
You’re navigating.
Common Nautical Chart Reading Mistakes
Beginners tend to make predictable mistakes.
Knowing them ahead of time can prevent them.
Assuming Charted Depth Equals Current Depth
It doesn’t.
Consider tide.
Forgetting the Boat’s Draft
Water depth means little unless you know how much your boat requires.
Measuring Distance Using Longitude
Use the latitude scale for traditional nautical-mile measurement.
Misunderstanding Large and Small Scale
Remember:
Large scale = smaller area, more detail.
Ignoring Chart Datum
Depth values require context.
Ignoring Tides
A route safe at high water may become dangerous later.
Misreading Rock Symbols
Different rock symbols describe different hazards.
Look them up if uncertain.
Assuming Every Wreck Is Harmless
Never assume.
Interpret the wreck symbol and surrounding depths.
Depending Entirely on GPS
Your GPS is a navigation aid.
It is not your entire navigation system.
Over-Zooming Electronic Charts
A larger picture does not necessarily mean more accurate information.
Ignoring Chart Notes
Important warnings may appear outside the part of the chart that attracts your attention.
Using Outdated Navigation Information
Charts and navigation aids change.
Keep them current.
Forgetting Overhead Clearance
Your keel is only half the clearance problem on a sailboat.
Drawing a Route Directly Beside Hazards
Give hazards breathing room.
Forgetting to Look Outside
This may be the most important mistake of all.
A chart helps you understand the world around you.
It should never prevent you from looking at that world.
Beginner Pre-Departure Chart Checklist
Before leaving on a coastal passage, work through a simple chart review.
- Confirm I have the correct chart for the area.
- Confirm the chart scale is appropriate.
- Confirm depth and height units.
- Check chart notes and warnings.
- Confirm the chart or electronic data is current.
- Identify my departure point.
- Identify my destination.
- Check the entire proposed route for hazards.
- Review minimum charted depths.
- Compare depths with my boat’s draft.
- Check tidal conditions.
- Check overhead clearances where relevant.
- Identify rocks, reefs, shoals and wrecks.
- Identify restricted areas, cables and pipelines.
- Identify useful buoys, beacons and lights.
- Measure the route distance.
- Estimate passage time.
- Identify alternate harbours or escape routes.
- Review weather and current conditions.
- Look outside and compare reality with the chart once underway.
Nautical Chart Reading Quiz
Try answering these before checking the answer key.
1. What is the main difference between a nautical chart and an ordinary road map?
A. Nautical charts are always electronic
B. Nautical charts emphasize information needed for marine navigation
C. Nautical charts do not show land
D. Nautical charts only show depths
2. Before interpreting depth numbers on a chart, what should you verify?
A. Boat speed
B. Engine horsepower
C. The chart’s depth units
D. Wind direction
3. Which generally contains more detailed information?
A. A large-scale harbour chart
B. A small-scale regional chart
4. One minute of latitude represents approximately how much distance?
A. One statute mile
B. One kilometre
C. One nautical mile
D. Ten nautical miles
5. Which chart scale is generally used to measure distance?
A. Longitude scale
B. Latitude scale
C. Compass rose
D. Depth contour
6. Your destination is 6 NM away and you average 5 knots. Approximately how long will the trip take?
A. 36 minutes
B. 60 minutes
C. 72 minutes
D. 120 minutes
7. What is a sounding?
A. A weather report
B. A charted water-depth measurement
C. A lighthouse signal
D. A magnetic compass correction
8. Your chart shows 1.8 m of water. The predicted tide height is 2.1 m. Approximately how deep might the water be using the simplified calculation?
A. 0.3 m
B. 1.8 m
C. 2.1 m
D. 3.9 m
9. Using the previous example, your boat draws 1.6 m. Approximately how much water would be beneath your keel?
A. 1.6 m
B. 2.3 m
C. 3.9 m
D. 5.5 m
10. Closely spaced depth contours usually suggest what?
A. Rapid change in underwater depth
B. Flat seabed
C. Strong wind
D. Heavy boat traffic
11. Why should sailors not rely on chart color alone?
A. Charts contain no standardized colors
B. Colours may vary by chart and display settings, and soundings and symbols provide essential context
C. Colours only indicate weather
D. Night navigation eliminates all color
12. What should you do if you encounter a chart symbol you do not recognize?
A. Ignore it
B. Assume it is harmless
C. Look it up in an official chart-symbol reference
D. Sail directly toward it
13. In the light description Fl(3) 10s, what does the 10s represent?
A. Height
B. Nominal range
C. Period of the full flashing sequence
D. Water depth
14. Canada uses which IALA buoyage region for lateral marks?
A. Region A
B. Region B
C. Region C
D. Canada does not use IALA
15. What is magnetic variation?
A. Change in tide height
B. Difference between true north and magnetic north
C. Difference between boat speed and current
D. Difference between latitude and longitude
16. Why should a sailor pay attention to submarine cables shown on a chart?
A. They improve GPS reception
B. They may indicate areas where anchoring is dangerous or prohibited
C. They mark deep water
D. They identify marinas
17. Why can over-zooming an electronic chart be dangerous?
A. It always turns the GPS off
B. It may give an impression of detail or precision not supported by the underlying chart data
C. It increases water depth
D. It changes your actual boat position
18. Why shouldn’t you route extremely close to a charted rock even when your GPS appears accurate?
A. GPS does not work near rocks
B. Chart, survey and position uncertainty still exist
C. Rocks move every day
D. Compasses stop working near rocks
19. What is the difference between course and heading?
A. There is no difference
B. Course is the intended direction of travel; heading is where the bow is actually pointing
C. Course measures water depth
D. Heading is only used by powerboats
20. What is the most important principle when using any nautical chart?
A. The chart replaces visual observation
B. Electronic charts are always more accurate than paper charts
C. Combine chart information with observation, instruments and good seamanship
D. Always choose the shortest route
Answer Key
1. B — Nautical charts emphasize information needed for marine navigation.
They show depths, hazards, navigation aids and other information specifically intended to help mariners navigate.
2. C — The chart’s depth units.
A sounding of 3 meters means something very different from 3 fathoms.
3. A — A large-scale harbour chart.
Large-scale charts generally cover smaller areas with greater detail.
4. C — One nautical mile.
One minute of latitude is approximately one nautical mile.
5. B — Latitude scale.
Traditional nautical chart distances are normally measured against the latitude scale.
6. C — 72 minutes.
6 NM ÷ 5 knots = 1.2 hours, or approximately 72 minutes.
7. B — A charted water-depth measurement.
A sounding represents depth at a surveyed location referenced to the chart’s depth datum.
8. D — 3.9 m.
1.8 m charted depth + 2.1 m tide height ≈ 3.9 m.
9. B — 2.3 m.
3.9 m total approximate depth − 1.6 m draft ≈ 2.3 m beneath the keel.
Remember that real passage planning still requires a safety margin.
10. A — Rapid change in underwater depth.
Closely spaced contours usually indicate a steep underwater slope or rapid depth change.
11. B — Colours require context.
Display colors may vary, and important navigation decisions should also consider soundings, contours, symbols and notes.
12. C — Look it up.
Never guess what an unfamiliar chart symbol means.
13. C — The period.
The complete flashing sequence repeats every 10 seconds.
14. B — IALA Region B.
Canada uses Region B lateral buoyage.
15. B — Difference between true and magnetic north.
Variation must be considered when converting between true and magnetic directions.
16. B — Anchoring may be restricted or dangerous.
Anchors can damage cables or pipelines and may become fouled on them.
17. B — Electronic zoom can create misleading apparent precision.
Magnifying a chart does not necessarily improve the underlying hydrographic information.
18. B — Uncertainty exists.
GPS positions, charted features and survey information all have limitations. Give hazards generous clearance.
19. B — Course vs heading.
Your intended course and actual bow direction may differ because of wind, leeway or current.
20. C — Combine navigation tools.
Charts, GPS, depth sounders, visual observation and sound judgement work together.
Final Thoughts
Learning how to read a nautical chart is one of the moments when sailing begins to feel less mysterious.
At first you see numbers and symbols.
Eventually you begin to see the coastline, the underwater terrain, the channels, the dangers and the possible routes through them.
You notice the 3-metre contour wrapping around a shoal.
You recognize the lighthouse on the headland.
You see the deeper channel between two shallow banks.
You notice the wreck you might otherwise have sailed toward.
You recognize that the shortest line between two points isn’t necessarily the safest one.
That is the real purpose of learning to read a nautical chart.
It isn’t about memorizing hundreds of symbols.
It’s about developing a mental picture of the environment around your boat and using that picture to make better decisions.
Start slowly.
Check the chart information first.
Understand the scale.
Identify the depths.
Find the hazards.
Study the tide.
Look for navigation aids.
Measure your route.
Then look outside.
With practice, what once looked like a page full of cryptic markings starts becoming something much more useful: